Best WiFi Heatmap Tools for Finding Dead Zones
We compared four WiFi heatmap tools on map clarity, survey workflow, platform support, planning features, plus the real cost of producing a useful coverage map.
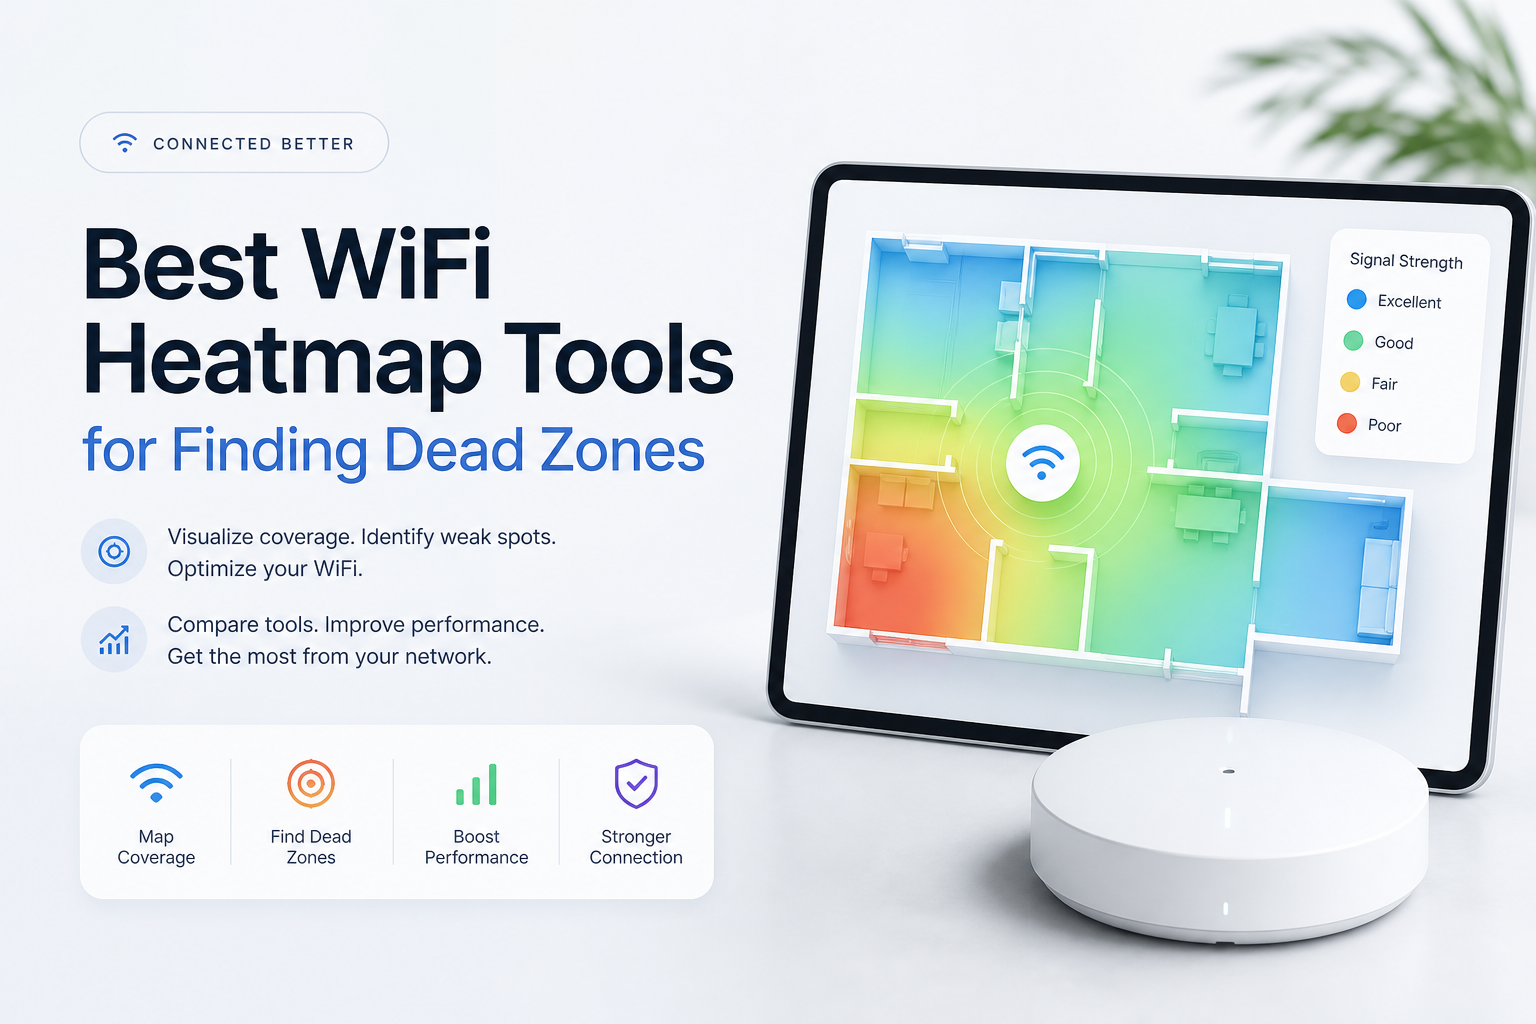
NetSpot is the best WiFi heatmap tool for most dead-zone checks. Its guided floor-plan survey, broad platform support, plus 20+ PRO visualizations make weak coverage easy to locate, then diagnose.
NetSpot
9.2/10Best for: Home users, small-business IT teams, or consultants who want readable dead-zone maps without enterprise-level hardware costs
- Clear floor-plan survey process
- More than 20 heatmap visualizations in PRO
- Runs on Windows plus macOS, with mobile options
- Predictive planning helps compare router locations
TamoGraph Site Survey
8.8/10Best for: Wireless consultants or network administrators validating offices, campuses, outdoor areas, or Wi-Fi 7 deployments
- Supports active, passive, predictive, plus outdoor surveys
- Detailed Wi-Fi 7 analysis
- Automatic access-point placement tools
- Useful PDF, HTML, plus ODT reporting
Acrylic Wi-Fi Heatmaps
8.4/10Best for: Windows-based contractors who need a one-month license for a defined installation or troubleshooting job
- One-month licensing suits occasional projects
- Wi-Fi 7 planning included
- Up to 15 heatmap types
- Editable DOCX, CSV, plus KMZ reports
Best WiFi Heatmap Tools for Dead Zones Compared
This table compares platform access, predictive planning, upfront pricing, plus our overall editorial score. Scores reflect workflow, map usefulness, feature access, plus cost rather than a controlled RF accuracy benchmark.
| Tool | Mobile Survey | Predictive Planning | Price | Score |
|---|---|---|---|---|
| 1. NetSpot PICK | ● Yes | ● Yes | $199 one-time | 9.2/10 |
| 2. TamoGraph Site Survey | ● No | ● Yes | $499/6 months | 8.8/10 |
| 3. Acrylic Wi-Fi Heatmaps | ● No | ● Yes | $129/month | 8.4/10 |
| 4. Hamina Onsite | ● Yes | ● No | $780/yr + $1,710 device | 8.1/10 |
The 4 Best WiFi Heatmap Tools for Finding Dead Zones, Reviewed
01 NetSpot
Windows, macOS, Android, iOS / Etwok
9.2/10
NetSpot
Windows, macOS, Android, iOS / Etwok
NetSpot gave us the best balance between a quick household survey plus the deeper information needed to explain a dead zone. Its floor-plan workflow is simple: calibrate the map, walk through the space, then click each measurement location. The resulting signal map makes weak rooms obvious without forcing the user to interpret a dense RF dashboard.
The PRO edition supplies 20+ visualization types, with views for signal level, interference, access-point count, upload rate, download rate, plus automated troubleshooting. It also supports predictive planning, so you can test possible access-point positions before moving equipment or drilling holes.
NetSpot is less expensive than the specialist survey suites here. The desktop free edition mainly covers nearby-network inspection, though, so buyers who need proper floor-plan heatmaps should budget for a paid license.
Best forHome users, small-business IT teams, or consultants who want readable dead-zone maps without enterprise-level hardware costs
- Clear floor-plan survey process
- More than 20 heatmap visualizations in PRO
- Runs on Windows plus macOS, with mobile options
- Predictive planning helps compare router locations
- $199 PRO license is modest beside commercial survey suites
- Desktop free edition does not provide the full survey workflow
- Several diagnostic views require PRO or Enterprise
- Accurate maps still require closely spaced measurements

02 TamoGraph Site Survey
Windows, macOS / TamoSoft
8.8/10
TamoGraph Site Survey
Windows, macOS / TamoSoft
TamoGraph is the strongest choice here for a formal post-installation validation survey. It covers passive, active, plus predictive work, while its automatic access-point location feature reduces the cleanup needed after a long walk-through. Heatmaps can show signal, noise, interference, expected data rates, or access-point coverage.
The current release supports Wi-Fi 7 plus 2.4, 5, and 6 GHz networks. Reports export to PDF, HTML, or ODT. GPS-assisted outdoor surveying also gives TamoGraph a clear edge for yards, campuses, marinas, or other spaces that do not fit neatly on an indoor floor plan.
That depth comes with a high entry price. The Standard edition costs $1,499, while predictive modeling requires PRO. A compatible adapter or spectrum analyzer can raise the real project cost further.
Best forWireless consultants or network administrators validating offices, campuses, outdoor areas, or Wi-Fi 7 deployments
- Supports active, passive, predictive, plus outdoor surveys
- Detailed Wi-Fi 7 analysis
- Automatic access-point placement tools
- Useful PDF, HTML, plus ODT reporting
- Optional spectrum analysis
- Far too expensive for a one-time home survey
- Predictive modeling is excluded from Standard
- Some workflows require separate survey hardware
03 Acrylic Wi-Fi Heatmaps
Windows / Tarlogic
8.4/10
Acrylic Wi-Fi Heatmaps
Windows / Tarlogic
Acrylic Wi-Fi Heatmaps makes unusual sense for a contractor with one upcoming survey. Its Basic plan starts at $129 for one month, while Advanced costs $149 for the same period. That is much easier to justify than a four-figure perpetual license when the job lasts a few days.
Basic includes 11 heatmap types, Wi-Fi 7 planning, 2.4 GHz, 5 GHz, plus 6 GHz coverage, automatic validation, plus editable reports. Advanced raises the map count to 15, then adds monitor mode, SNR analysis, spectrum-analyzer support, plus connected-client identification.
The catch is platform support. Acrylic runs on Windows 10 or 11, with no native macOS version. Advanced capture features may also depend on a compatible wireless adapter.
Best forWindows-based contractors who need a one-month license for a defined installation or troubleshooting job
- One-month licensing suits occasional projects
- Wi-Fi 7 planning included
- Up to 15 heatmap types
- Editable DOCX, CSV, plus KMZ reports
- Fifteen-day evaluation period
- Windows only
- Advanced capture depends on compatible adapters
- Perpetual pricing approaches enterprise survey-suite territory
04 Hamina Onsite
iOS, iPadOS, macOS / Hamina Wireless
8.1/10
Hamina Onsite
iOS, iPadOS, macOS / Hamina Wireless
Hamina Onsite is built around a different survey experience. Rather than relying only on a laptop's internal radio, it pairs the mobile app with an Oscium Nomad measurement device. Coverage updates while you walk, making it easier to notice a missed room or an overly wide gap between sampling points.
The kit measures 2.4, 5, and 6 GHz networks, with maps for signal strength, coverage, SNR, plus interference. Projects sync to Hamina Cloud for later analysis or reporting in Planner. It also supports access-point-on-a-stick surveys before permanent equipment is installed.
The hardware-first setup is excessive for a homeowner tracing a weak bedroom signal. Pricing starts with a $1,710 device purchase, followed by a $780 yearly per-user subscription.
Best forNetwork engineers who prefer collecting live 6 GHz survey data with an iPhone or iPad instead of carrying an open laptop
- Comfortable iPhone or iPad collection workflow
- Dedicated hardware provides consistent survey readings
- Real-time maps reveal missed sampling areas
- Supports 6 GHz networks
- Cloud sync helps teams review field work
- Requires a $1,710 measurement device
- Ongoing per-user subscription
- Poor value for basic household troubleshooting
How We Evaluated WiFi Heatmap Tools for Dead-Zone Surveys
We reviewed each tool around a typical dead-zone job: importing or drawing a floor plan, calibrating its scale, collecting readings, isolating weak-signal areas, checking interference, then exporting or revisiting the results. Extra credit went to tools that separate low signal from poor SNR or congestion, since adding another access point does not fix every slow room.
Pricing was judged by the lowest paid tier capable of producing useful heatmaps. Scores also account for platform limits, required hardware, predictive planning, report options, plus whether the workflow is realistic for one person walking through a house or office.
How to Choose a WiFi Heatmap Tool for Your Building
For a house or small office, prioritize an easy floor-plan survey plus clear signal-level maps. Predictive planning is helpful if you have not bought the new access point yet. It lets you model walls, doors, building materials, or possible router positions before changing the physical setup.
Commercial installers should look beyond basic signal strength. SNR, channel overlap, secondary coverage, roaming, spectrum data, plus editable reports become more useful in busy offices. Check hardware compatibility before paying, particularly on Windows systems that use monitor-mode adapters or external spectrum analyzers.
Common WiFi Heatmap Survey Mistakes That Hide Dead Zones
Do not take readings only in the center of each room. Dead spots often form beside masonry walls, metal appliances, mirrors, stairwells, or closed doors. Use a consistent walking grid, then place extra points near the exact desk, television, camera, or bed where the connection fails.
A single map can also mislead. Run separate checks for 2.4 GHz, 5 GHz, plus 6 GHz where available. Repeat the survey during a busy period. A room with acceptable signal may still perform badly because of interference, overloaded channels, or a client sticking to a distant mesh node.
Which WiFi Heatmap Tool Should You Use?
NetSpot earns first place because it provides enough diagnostic depth for serious troubleshooting without turning a home or small-office survey into a hardware project. TamoGraph is the better fit for formal professional validation, while Acrylic offers practical short licenses for Windows contractors. Hamina Onsite makes sense when a mobile field workflow plus dedicated measurement hardware matter more than price.
Survey the same weak room before plus after moving the router or access point, using identical measurement locations so the two maps are genuinely comparable.